Your electricity bill is not going down. India’s grid tariffs have risen between 4% and 7% annually for the last five years. In states like Maharashtra and Karnataka, large commercial consumers are now paying upwards of Rs 12 per unit. And that number will not stay still.
Against that backdrop, the question most business owners ask about solar is the right one: how long before I get my money back? In 2026, the honest answer is 3 to 5 years for most commercial and industrial installations under the CAPEX model. For high-tariff consumers above Rs 10 per unit, it drops to 2.5 to 3 years. For ground-mounted industrial plants, the range is 4 to 5 years.
But the range hides everything that matters. The same 500 kW system installed in two different factories, under two different procurement decisions, with two different commissioning dates, can produce payback periods that are separated by 18 months. The 2026 policy environment has introduced variables that make the EPC partner’s technical and financial guidance more consequential than ever.
This guide gives you the actual numbers, the actual policy levers, and the actual calculations. Solarsure builds this analysis into every project proposal before a single panel is quoted.
What Does “Payback Period” Actually Mean for a Solar Plant?
The payback period is the time it takes for the cumulative financial benefits of your solar plant to equal the total upfront investment. Simple payback uses only electricity savings. Effective payback the number that actually governs investment decisions also accounts for tax benefits, GST input tax credit recovery, and the compounding effect of annual tariff escalation.
Simple Payback = Total System Cost (Rs) divided by Annual Electricity Savings (Rs).
Effective Payback = (Total System Cost minus Year 1 Tax Benefit minus GST ITC) divided by Annual Savings. This is the number Solarsure models for every client.
💡 On a Rs 2 crore system at a 25% corporate tax rate, accelerated depreciation alone produces Rs 20 lakh in Year 1 tax savings — reducing effective CAPEX before a single unit of electricity is generated.
What Has Changed in 2026: Policy Shifts That Directly Impact Your Payback
Understanding the 2026 policy environment is not optional for any business making a solar investment decision. Several key parameters have changed, and most EPC vendors will not proactively explain the ones that could work against you.
No Central Capital Subsidy for C&I: But Here Is What You Do Have
There is no central government capital subsidy for commercial or industrial solar installations in 2026. The PM Surya Ghar Muft Bijli Yojana which provides up to Rs 78,000 in direct subsidy, is exclusively for residential consumers. Any EPC company claiming a “government subsidy” for your factory installation is misrepresenting the policy. The MNRE is clear on this.
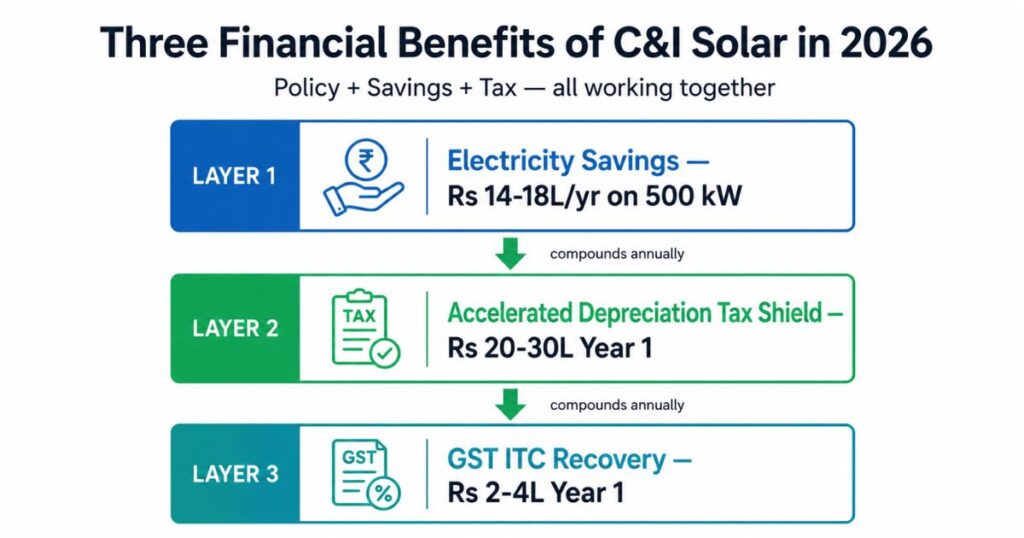
What C&I businesses do have is more powerful than a flat subsidy for most profitable companies: a 40% accelerated depreciation benefit under Section 32 of the Income Tax Act, plus GST Input Tax Credit recovery on system components. Together, these two mechanisms reduce your effective first-year CAPEX by 25% to 35% more than most residential subsidies.
⚠ As of 2026, Niti Aayog has proposed a PM Surya Ghar-like scheme for MSMEs. It is NOT approved or available yet. Do not factor any such subsidy into your investment model.
Accelerated Depreciation: The Policy Lever Most Business Owners Miss
Under Section 32 of the Income Tax Act, solar power systems are classified in a special asset category eligible for 40% Written Down Value (WDV) depreciation in the year of commissioning. Manufacturing businesses can claim an additional 20% under Section 32(1)(iia), bringing total Year 1 depreciation to 60%.
| Business Type | Year 1 AD Rate | Tax Saving (25% bracket) on Rs 2 Cr Plant |
| Commercial (Office, Mall, Hotel) | 40% | Rs 20 Lakh |
| Manufacturing MSME / Industrial Plant | 60% (Year 1) | Rs 30 Lakh |
| Post-Oct 3 commissioning (half-year rule) | 20% only | Rs 10 Lakh (benefit halved) |
The Half-Year Rule: Why Your Commissioning Date Is a Financial Decision
If your solar plant is commissioned and operational for more than 180 days in a financial year meaning before October 3rd you claim the full 40% (or 60%) depreciation benefit that year. If commissioned after October 3rd, the rate halves: 20% instead of 40% for commercial, 30% instead of 60% for manufacturing.
On a Rs 2 crore plant at a 25% tax rate, the difference between a September commissioning and a November commissioning is Rs 10 lakh in Year 1 cash flow. This is not a minor accounting detail. It is a project scheduling decision with a direct rupee value and it is one of the first things Solarsure aligns with clients during the planning phase.
Net Metering and Open Access: The State Variable
Net metering allows you to offset your electricity bill unit-for-unit against solar generation, with surplus exported to the grid credited at a feed-in tariff. In 2026, most states support net metering for C&I systems up to 500 kW, but the crediting mechanism monthly rollover vs. quarterly settlement vs. annual banking varies significantly.
States like Gujarat and Haryana allow 12-month credit banking, maximising the value of every unit generated even in low-consumption months. Maharashtra settles quarterly, which reduces the value of surplus generation. For plants above 1 MW, open access frameworks apply, introducing cross-subsidy surcharges that vary by state and materially affect payback calculations.
📖 You can also read: Scope 1, 2 & 3 Emissions: A Complete Guide for Businesses
Payback Period Benchmarks for C&I Solar in India 2026
The table below gives simple and effective payback benchmarks by installation type and grid tariff band. Effective payback accounts for 40% AD (commercial) and 5% GST ITC. Manufacturing businesses with 60% AD in Year 1 will see figures 4 to 8 months shorter than the effective column.
| Segment | Tariff (Rs/unit) | System Cost | Simple Payback | Effective Payback (with AD + GST ITC) |
| Commercial Rooftop (100–500 kW) | Rs 12–14 | Rs 40–50L / 100 kW | 2.5–3 yrs | 2.0–2.5 yrs |
| Commercial Rooftop (100–500 kW) | Rs 8–10 | Rs 40–50L / 100 kW | 3.5–4.5 yrs | 3.0–4.0 yrs |
| Industrial Rooftop (500 kW–2 MW) | Rs 8–10 | Rs 32–38L / 100 kW | 3.5–5 yrs | 2.8–4.0 yrs |
| Ground-Mounted Industrial (1 MW+) | Rs 7–9 | Rs 30–38L / 100 kW | 4–5.5 yrs | 3.2–4.5 yrs |
| PPA / RESCO Model (any size) | Any | Zero CapEx | Day 1 savings | No payback period — savings begin immediately |
All figures assume Bifacial TOPCon panels, which is Solarsure’s standard specification for all C&I and industrial projects in 2026. Plants using Mono PERC will show approximately 8 to 12% lower annual generation, extending payback by 4 to 8 months versus these benchmarks.
The Four Variables That Determine YOUR Payback Period
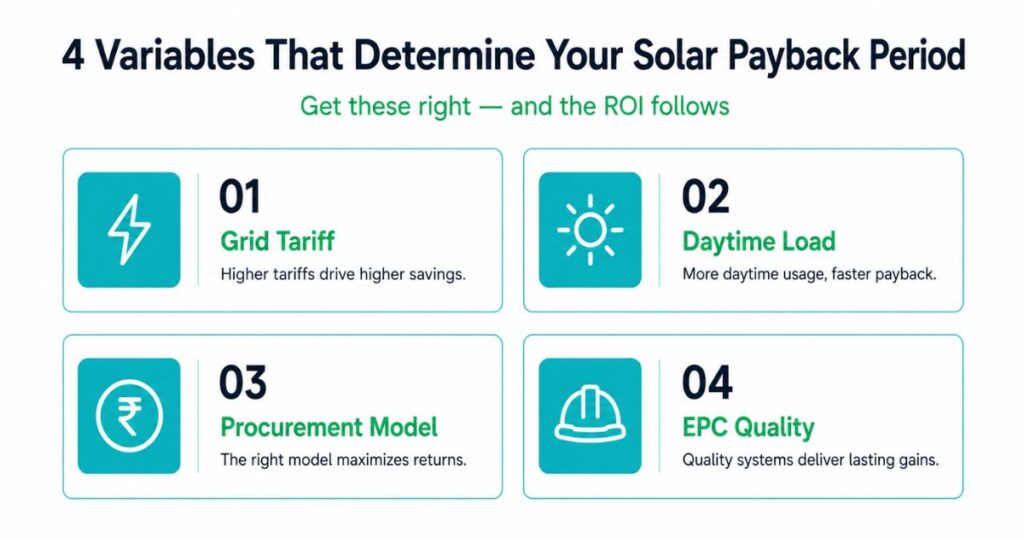
No two C&I solar projects have identical payback periods. These four variables are the ones that move the number most and the ones Solarsure analyses in every site assessment before a single figure is committed to a proposal.
1. Grid Tariff : The Single Biggest Driver
Every additional Re 1 per unit you currently pay the grid directly shortens your payback. A plant paying Rs 11 per unit in Maharashtra will recover costs roughly 14 months faster than an identical plant paying Rs 7.5 per unit in a lower-tariff state. Run your calculation against your actual sanctioned load tariff not a state average.
2. Daytime Load Alignment
Solar generates between 8 AM and 5 PM. Factories running continuous day-shift operations food processing, textiles, auto components, plastics capture the full value of every unit generated. Facilities with high night-shift consumption cannot use solar generation directly without battery storage, which changes the financial model significantly.
Over-sizing your plant relative to daytime load creates surplus you cannot monetise efficiently under most state net metering policies. Under-sizing leaves significant grid spend untouched. The correct system size is determined by your load profile not your roof area.
3. Procurement Model CAPEX, PPA, or Solar Loan
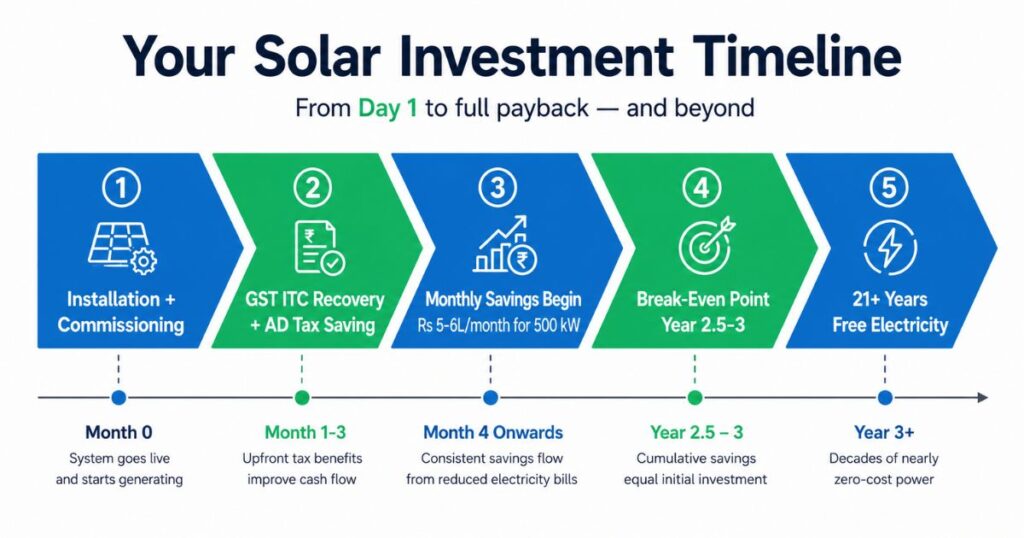
CAPEX: You own the asset. Full accelerated depreciation and GST ITC apply. Highest long-term returns. Payback 2.5 to 5 years depending on tariff and tax position.
PPA / RESCO: Developer owns and maintains the plant. You pay a fixed per-unit rate below your current grid tariff. Zero upfront. Savings from Day 1. You do not benefit from AD. Optimal for businesses prioritising cash flow over long-term returns.
Solar Loan (SIDBI 4E / NBFC): SIDBI’s 4E scheme offers loans at 7–8% interest, covering up to 100% of project cost with a ceiling of Rs 7.5 crore. Monthly EMI on most 500 kW systems is lower than the monthly electricity savings generated meaning the system is cash-flow positive from Month 1.
4. EPC Execution Quality
A poorly designed or under-specified installation can reduce actual generation by 15 to 25% versus what was modelled, extending payback permanently. Wrong panel specification, inadequate shadow analysis, undersized cable sizing, or incorrect inverter selection are execution failures that show up in your generation report 12 months after commissioning not before.
⚠ Module substitution — being quoted TOPCon but receiving Mono PERC after contract signing is the most common financial trap in India’s C&I solar market. Solarsure locks panel brand, model number, and efficiency specification in the contract before procurement. If your EPC cannot do this, that is a red flag, not a negotiation point.
Real Numbers: A 500 kW Food Processing Plant in Madhya Pradesh
Madhya Pradesh’s industrial HT tariff for large commercial consumers sits between Rs 8 and Rs 9.50 per unit depending on the feeder and load category. Here is what a 500 kW rooftop CAPEX system commissioned in August 2026 looks like financially.
| Parameter | Value |
| System Capacity | 500 kW (625 kWp DC, Bifacial TOPCon) |
| Gross System Cost | Rs 1.85 crore (Rs 37,000/kW) |
| Annual Generation (MP irradiance) | ~7.25 lakh units (kWh) |
| Applicable Grid Tariff | Rs 8.80 per unit (HT industrial, MP) |
| Annual Electricity Savings | Rs 63.8 lakh |
| Simple Payback | 2.9 years |
| Year 1 AD Benefit (40% WDV, 25% tax) | Rs 18.5 lakh cash saving (Year 1) |
| GST ITC Recovery (~5%) | Rs 9.25 lakh (Year 1) |
| Effective Net CAPEX (after Year 1 benefits) | Rs 1.85Cr – Rs 27.75L = Rs 1.57 crore |
| Effective Payback | 2.46 years |
| IRR (25-year model) | ~19.5% |
| Total 25-Year Saving (4.5% annual tariff escalation) | Rs 4.8 crore |
✅ Manufacturing businesses in MP with 60% AD (40% standard + 20% additional under Section 32(1)(iia)) reduce effective payback on this same system to approximately 2.1 years.
State-Wise Payback Comparison for C&I Solar in 2026
Grid tariff is the primary driver of payback variation across India. The table below shows indicative effective payback for a 500 kW rooftop CAPEX system with standard 40% AD applied.
| State | Avg C&I Tariff | Net Metering | Simple Payback | Eff. Payback |
| Maharashtra | Rs 11–14/unit | Quarterly settlement | 2.5–3.5 yrs | 2.0–2.8 yrs |
| Karnataka | Rs 9–12/unit | Annual banking | 2.8–3.8 yrs | 2.2–3.0 yrs |
| Tamil Nadu | Rs 9–11/unit | Annual banking | 3.0–4.0 yrs | 2.4–3.2 yrs |
| Madhya Pradesh | Rs 7.5–9.5/unit | Annual banking | 2.9–4.2 yrs | 2.3–3.4 yrs |
| Rajasthan | Rs 7–9/unit | Annual banking | 3.5–5.0 yrs | 2.8–4.0 yrs |
| Gujarat | Rs 8–10/unit | Annual banking (12M) | 3.0–4.0 yrs | 2.4–3.2 yrs |
Note: Effective payback figures assume commissioning before October 3rd to capture full-year accelerated depreciation. Tariff figures are indicative for HT industrial category; verify your specific tariff order with your CA and EPC partner.
📖 You can also read: Solar Panel Technologies Explained: TOPCon vs Mono PERC
The One Risk That Permanently Stretches Your Payback Period
The biggest financial risk in a C&I solar investment is not policy change or tariff revision. It is installing the wrong system or not installing the system that was quoted.
A 15% shortfall in actual versus modelled generation on a 500 kW plant in MP means Rs 9.5 lakh less in annual savings. Over 25 years, with tariff escalation factored in, that shortfall compounds to Rs 68 lakh in lost electricity cost savings from a single specification error. This is why the Detailed Project Report, the load analysis, and the component specification are not administrative formalities. They are the financial foundation of the entire investment.
At Solarsure, every C&I project begins with a site-specific irradiance analysis, a load profile assessment, and a 25-year generation model. The panel brand, model number, efficiency rating, temperature coefficient, and annual degradation rate are written into the contract before procurement begins. Delivery documentation and manufacturer test reports are verified on arrival at site.
The payback period in your proposal should match the payback period in your generation report 24 months later. If your EPC cannot guarantee that with documentation, the risk sits entirely with you.
Frequently Asked Questions
Q: Is there any government subsidy for commercial or industrial solar in 2026?
A: No. The PM Surya Ghar Muft Bijli Yojana subsidy of up to Rs 78,000 is exclusively for residential consumers. C&I businesses do not receive a direct capital subsidy from the central government in 2026. However, 40% accelerated depreciation under Section 32 and GST Input Tax Credit recovery reduce effective CAPEX by 25–35% in Year 1 a larger benefit than most residential subsidies for profitable businesses.
Q: What is the payback period for a 500 kW commercial solar plant in Madhya Pradesh in 2026?
A: For a Bifacial TOPCon CAPEX system commissioned before October 3rd, effective payback on a 500 kW plant in MP (HT tariff Rs 8.80/unit) is approximately 2.4 to 2.6 years after accounting for 40% accelerated depreciation and GST ITC. Manufacturing businesses with 60% AD see this drop to approximately 2.1 years. Simple payback without tax benefits is 2.9 years.
Q: What is the half-year rule and how does it affect my solar ROI?
A: Under Section 32 of the Income Tax Act, if a solar asset is commissioned and operational for more than 180 days in a financial year before October 3rd you claim the full depreciation rate (40% or 60%). Commission after October 3rd, and the rate is halved. On a Rs 2 crore plant at 25% tax rate, the cash flow difference is Rs 10 lakh in Year 1. Commissioning date is a financial decision, not just a construction milestone.
Q: Should I choose CAPEX or PPA for a commercial solar installation?
A: CAPEX delivers higher long-term returns and full accelerated depreciation benefits. It is optimal for profitable businesses with taxable income and adequate capital or access to SIDBI 4E financing at 7–8% interest. PPA eliminates upfront cost and delivers immediate savings from Day 1, but the developer retains the depreciation benefit. The right choice depends on your tax position, balance sheet, and cash flow priorities — Solarsure models both for every client before a recommendation is made.
Q: Does solar panel technology choice affect the payback period?
A: Yes, materially. Bifacial TOPCon panels generate approximately 8 to 12% more electricity annually than Mono PERC at the same installed capacity, due to bifacial gain, lower temperature coefficient, and reduced annual degradation. On a 25-year model, this difference on a 500 kW MP plant amounts to Rs 35–50 lakh in additional generation savings. Solarsure specifies Bifacial TOPCon (N-type, minimum 21.5% efficiency) as the standard for all C&I and industrial projects in 2026.
Q: What is the IRR for a commercial solar investment in India in 2026?
A: Most C&I CAPEX solar projects in India deliver an IRR of 18 to 22% post-tax in 2026, well above typical corporate hurdle rates of 12 to 15%. High-tariff state projects (Maharashtra, Karnataka) in the 22–24% range. Ground-mounted industrial projects in lower-tariff states sit at the 16–19% range. These figures assume standard 40% AD, 4.5% annual tariff escalation, and a Bifacial TOPCon specification with less than 0.45% annual degradation.
Bottom Line
In 2026, the payback period for commercial and industrial solar in India is not a guess. It is a calculation and the inputs are more favourable than they have ever been. Effective payback of 2 to 3.5 years for most C&I businesses. IRR of 18 to 22%. Twenty-plus years of near-zero generation cost after that.
What determines whether your project hits those numbers is not the government policy that environment is favourable. It is the quality of the financial modelling, the accuracy of the site assessment, and the integrity of the specification that gets locked in before you sign.
Solarsure builds a site-specific 25-year generation and financial model for every C&I project including tariff-band analysis, AD calculation, GST ITC projection, and commissioning timeline at no cost as part of the site assessment. The payback number in your proposal should be a number your CA can verify and your accountant can confirm.