
Solar for MSMEs in 2026 : Your factory pays Rs 8, Rs 9, maybe Rs 12 per unit to the DISCOM. That bill arrives every month and goes up every year. It is not a cost you negotiated, not a cost you can easily reduce, and not a cost that has any reasonable prospect of coming down. The grid is not getting cheaper for industrial consumers.
Open access solar changes that equation at the root. It allows your factory or MSME to source electricity directly from a solar plant wheeled through the existing state grid and land power at your facility for Rs 3.50 to Rs 5.50 per unit all-in. That is a 30 to 40 percent reduction on your single largest operational variable cost, locked in for 20 to 25 years.
India added a record 7.8 GW of solar open access capacity in 2025 alone, crossing 30 GW cumulative. The pipeline entering 2026 stands at 45+ GW. The factories and MSMEs participating in this market are not doing it for ESG optics. They are doing it because the savings are real, the mechanism is legally established, and the competitive advantage of lower energy costs compounds every year.
This guide covers everything a MSME owner or factory operator needs to know: what open access solar is, who qualifies, what it actually costs after all charges, the three procurement models, how to compare states, and the exact steps to start your project.
| 30+ GW
Cumulative open access solar India (end 2025) |
7.8 GW
Record additions in 2025 alone |
Rs 3.5–5.5
Typical all-in landed cost per unit |
30–40%
Average electricity cost reduction |
What Is Open Access Solar? The Legal Foundation Every Factory Owner Must Understand
Open access solar is a legal mechanism established under Section 42 of the Electricity Act, 2003. It gives large electricity consumers the right to source power from a generator of their choice outside the local DISCOM by using the state’s existing transmission and distribution infrastructure.
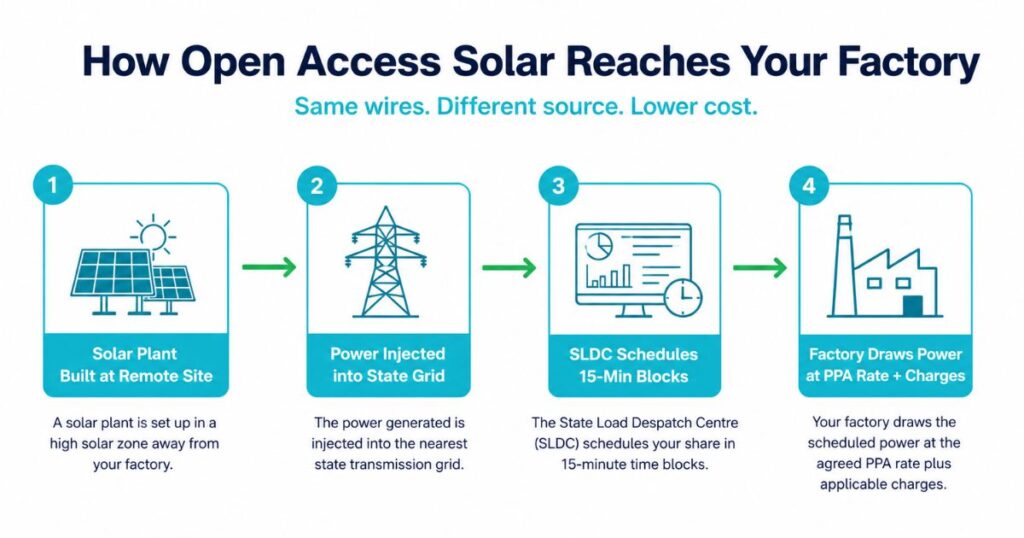
In plain terms: a solar plant is built at a high-irradiance location (often in Rajasthan, MP, Karnataka, or near your state’s solar zones), connected to the state grid, and its output is “wheeled” to your factory’s meter. You pay the solar developer a contracted PPA ratesignificantly lower than DISCOM tariff plus regulated charges to the state for grid usage. The difference between what you were paying and what you now pay is your saving.
The fundamental equation: DISCOM tariff (Rs 8–12/unit) minus Landed Open Access Cost (Rs 3.5–5.5/unit) = Rs 3–7/unit recurring saving. On 1 lakh units per month, that is Rs 3–7 lakh per month Rs 36–84 lakh per year from a single procurement decision.
💡 Open access solar does not replace your DISCOM connection. You retain your grid connection for backup and night-time consumption. Open access simply replaces the majority of your daytime energy purchase from the DISCOM with cheaper solar power wheeled through the same wires.
Who Is Eligible for Open Access Solar? The Threshold MSMEs Get Wrong
The minimum eligibility threshold for renewable open access in most states is a contract demand of 100 kW. Some states including certain DISCOM zones in Maharashtra and Rajasthan require 500 kW. Your HT (High Tension) connection status matters too: most states require an HT connection for open access eligibility, though CERC’s Green Energy Open Access Rules 2022 pushed for 100 kW as the national floor.
For most factories and MSMEs running machinery, production lines, or HVAC-heavy operations, a monthly electricity bill above Rs 5 lakh typically corresponds to a load profile that qualifies. If your bill is Rs 10 lakh or more per month, open access solar should be treated as an immediate priority not a future option.
| Business Type | Typical Monthly Bill | Open Access Suitability |
| Large industrial factory (textiles, auto, plastics) | Rs 15–50 lakh+ | ✅ Highest priority — start immediately |
| Mid-size MSME (food processing, pharma, packaging) | Rs 5–15 lakh | ✅ Eligible — model selection critical |
| MSME cluster (group of smaller units in same zone) | Rs 1–5 lakh each | ✅ Group captive structure opens eligibility |
| Small commercial (shop, office, small factory) | Below Rs 1 lakh | ⚠ Below threshold — rooftop solar preferred |
📌 If your individual load is below the threshold but you are part of an industrial cluster or estate, a Group Captive structure allows multiple MSMEs to pool their equity in one plant and collectively consume 51% of its output — bringing each unit’s savings in line with a fully captive consumer. This is the primary route for smaller MSMEs to access open access economics.
Understanding the 5 Open Access Charges The Numbers That Determine Your Savings
Open access solar is not free transmission. You are using the DISCOM’s grid infrastructure to wheel power from a remote plant to your meter, and you pay regulated charges for that use. Understanding these five charge categories is the difference between a realistic savings model and a vendor’s optimistic pitch.
| Charge | What It Covers | Typical Range | Captive Exempt? | Impact |
| 1. Generation Tariff (PPA Rate) | Payment to the solar developer for electricity generated | Rs 2.20–2.80/unit | N/A (PPA rate) | HIGH |
| 2. Wheeling / Distribution Charges | Grid usage for transporting power within state distribution network | Rs 0.29–1.20/unit | No | MEDIUM |
| 3. Cross-Subsidy Surcharge (CSS) | Compensates DISCOM for lost revenue when large consumers exit grid | Rs 0.60–3.50/unit | YES — Captive & Group Captive | VERY HIGH |
| 4. Additional Surcharge | Covers stranded costs on account of open access consumers | Rs 0–0.30/unit | YES — Captive & Group Captive | LOW–MEDIUM |
| 5. Transmission Loss (% deduction) | Energy lost in high-voltage transmission; deducted from delivered units | 3.5–5.5% of units | No | LOW |
| Banking Charges (if applicable) | Storing surplus solar in the grid for drawing later (night-time, weekends) | 2–8% of banked units | No | MEDIUM |
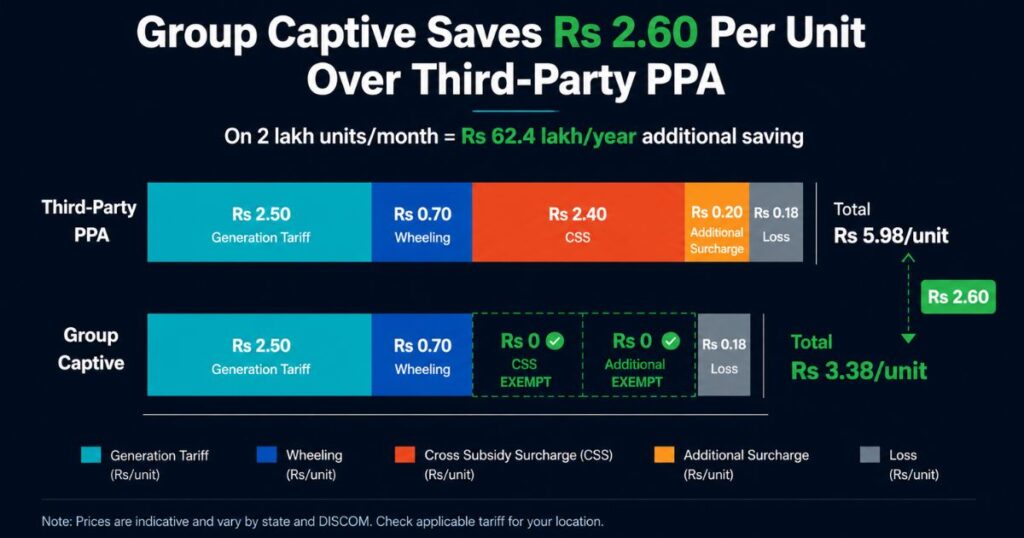
The critical insight: CSS is the single most expensive charge and it is entirely waived for captive and group captive consumers under the Electricity Act 2003. In Maharashtra, full CSS for third-party open access consumers is Rs 3.20/unit. A factory consuming 2 lakh units per month saves Rs 6.4 lakh per month Rs 76.8 lakh per year simply by choosing a captive or group captive structure over a third-party PPA.
The Three Open Access Models — Which One Is Right for Your Business?
Every open access solar project operates under one of three legal structures. The choice determines your upfront investment, tax benefits, CSS exemption status, and long-term returns. Most EPC vendors will only offer you the structure that is easiest for them to sell. Here is the objective comparison.
01 Third-Party PPA (Power Purchase Agreement) Zero capital. Immediate savings. CSS applies in full.
A solar developer owns and builds a plant at their own cost. You sign a Power Purchase Agreement to purchase electricity from that plant at a fixed per-unit rate for 20 to 25 years. You pay no upfront capital, no CAPEX, no construction risk. Savings begin on the day of commissioning.
The trade-off: CSS and Additional Surcharge apply in full, significantly increasing your landed cost compared to captive structures. In high-CSS states like Maharashtra (Rs 3.20/unit CSS), the landed cost on a third-party PPA can approach Rs 6 to Rs 7 per unit narrowing your savings margin against the DISCOM considerably.
| Best For | Watch Out For |
| Businesses with zero capital or balance sheet constraints | High CSS states Maharashtra, Tamil Nadu erode savings significantly |
| Companies prioritising immediate cash-flow positive savings | You don’t own the asset no AD benefit, no equity appreciation |
| Low-CSS states: Karnataka, Rajasthan, MP, Gujarat | PPA rate locks are long-term ensure escalation clause is capped |
02 Captive Power Plant (Self-Ownership) You own the asset. Maximum savings. Full AD benefit. CSS exempt.
You own and operate the solar plant directly either on your own premises (rooftop or on-site ground mount) or at a remote location. Because you own the generation asset, you qualify as a “captive consumer” under the Electricity Act 2003, making your consumption fully exempt from CSS and Additional Surcharge.
You also claim the full 40% accelerated depreciation benefit under Section 32, and GST ITC recovery on plant components. These tax benefits, combined with CSS exemption, make captive the highest-ROI model for profitable businesses with capital or access to green financing.
| Best For | Requirements |
| Profitable businesses with taxable income (AD benefit applies) | Capital investment required own the plant fully |
| Large C&I consumers above 500 kW with HT connection | If ground-mounted at remote site land procurement or lease needed |
| Businesses seeking maximum 25-year energy cost advantage | SIDBI 4E loan at 7–8% can finance 100% EMI < monthly savings |
03 Group Captive — The MSME Game-Changer 26% equity in shared plant. CSS exempt. No full capital needed.
Group captive is the structure that opens full captive economics to MSMEs and smaller factories that cannot individually fund or operate a dedicated solar plant.
Under the Electricity Act 2003, a group of consumers collectively owning at least 26% equity in a solar plant, and consuming at least 51% of its output, qualifies as captive consumers entitling them to full CSS and Additional Surcharge exemption. The remaining 49% output and 74% equity sits with the developer or other consortium members.
The MSME opportunity: Five textile mills in Indore, each consuming 80,000 units per month, can collectively form a Special Purpose Vehicle (SPV), acquire 26% equity in a 5 MW solar plant, and source power at Rs 3.40 to Rs 3.80 per unit all-in fully CSS exempt from a shared plant that none of them could individually afford or manage.
| Parameter | Third-Party PPA | Group Captive |
| Upfront equity | Zero | 26% of plant cost |
| CSS Status | Fully applicable | EXEMPT |
| Additional Surcharge | Applicable | EXEMPT |
| Accelerated Depreciation | No (developer claims) | Yes (on equity portion) |
| Landed cost (Maharashtra example) | Rs 5.80–6.50/unit | Rs 3.20–3.80/unit |
| Ideal for | States with low CSS; balance-sheet-constrained buyers | MSMEs in clusters; medium factories seeking maximum savings |
📖 You can also read: What Is the Real Payback Period for C&I Solar Under 2026 Policies?
What Open Access Solar Actually Costs State-Wise Landed Cost (2026)
The landed cost is the only number that matters. It is what you actually pay per unit delivered to your factory meter, after all charges. Use this formula and the table below to calculate your saving before you speak to a single vendor.
Landed Cost = Generation Tariff + Wheeling Charge + CSS (if applicable) + Additional Surcharge + Transmission Loss
| State | HT Tariff | Wheeling | CSS (3rd Party) | Landed Cost | Saving vs DISCOM |
| Karnataka | Rs 6.60/unit | Rs 0.29 | Rs 0.60 | Rs 3.88/unit | 41% saving — best in class for 3rd party PPA |
| Madhya Pradesh | Rs 8.80/unit | Rs 0.55 | Rs 0.80 | Rs 4.05/unit | 54% saving — strong economics for C&I and PM KUSUM EPC |
| Rajasthan | Rs 8.50/unit | Rs 0.50 | Rs 0.75 | Rs 3.75/unit | 56% saving — highest irradiance; BESS integration advancing |
| Gujarat | Rs 9.20/unit | Rs 0.65 | Rs 1.00 | Rs 4.35/unit | 53% saving — single-window clearance improving |
| Maharashtra | Rs 12.50/unit | Rs 0.70 | Rs 3.20 | Rs 6.58/unit | 47% saving — high CSS makes Group Captive strongly preferred over 3rd-party PPA |
| Tamil Nadu | Rs 10.50/unit | Rs 0.60 | Rs 1.80 | Rs 5.10/unit | 51% saving — banking restrictions now 15-min blocks; careful sizing needed |
Note: Landed cost figures shown are for Third-Party PPA model. Group Captive costs are Rs 1.80–2.60/unit lower in CSS-applicable states due to full exemption. Figures are indicative for FY 2025-26; verify current tariff orders with your state DISCOM before financial modelling.
🚨 ISTS (Inter-State Transmission System) charge waiver phase-out: Projects commissioned before June 2025 received a full 25-year ISTS waiver. From FY26, waivers reduce annually (75% in FY26, 50% in FY27, 25% in FY28, 0% from July 2028). This adds Rs 0.15–0.25/unit to inter-state open access costs. Intra-state procurement and Group Captive structures are strongly preferred in 2026 for this reason.
The MSME-Specific Opportunity Industry Clusters and Smart Structuring
India’s MSME sector has historically been under-served by open access solar not because the economics don’t work, but because the individual contract demand of a single MSME often falls below the eligible threshold. The Group Captive structure resolves this directly.
MSME Clusters That Should Act Now
Every major industrial cluster in India is a natural Group Captive candidate. Textile mills in Surat, Indore, and Ludhiana. Auto component manufacturers in Pune, Chennai, and Gurugram. Pharma units in Baddi, Hyderabad, and Ahmedabad. Food processing MSMEs in MP, Rajasthan, and Maharashtra. These are day-shift-heavy operations with strong daytime electricity loads that align naturally with solar generation hours.
| Sector | Daytime Load Alignment | Monthly Bill (typical) | Open Access Model |
| Textile / Garment Manufacturing | Excellent (day shifts) | Rs 8–25 lakh | Group Captive preferred |
| Auto Components | Excellent (press shop, CNC) | Rs 15–60 lakh | Captive / Group Captive |
| Food Processing & Cold Chain | Good (daytime processing) | Rs 5–20 lakh | Group Captive + BESS |
| Pharmaceuticals | Very good (24×7 possible) | Rs 20–80 lakh | Captive + BESS integration |
| Cement / Building Materials | Excellent (crushers, kilns) | Rs 30–150 lakh | Captive (own plant) |
How to Start – The 5-Step Process for MSMEs and Factories
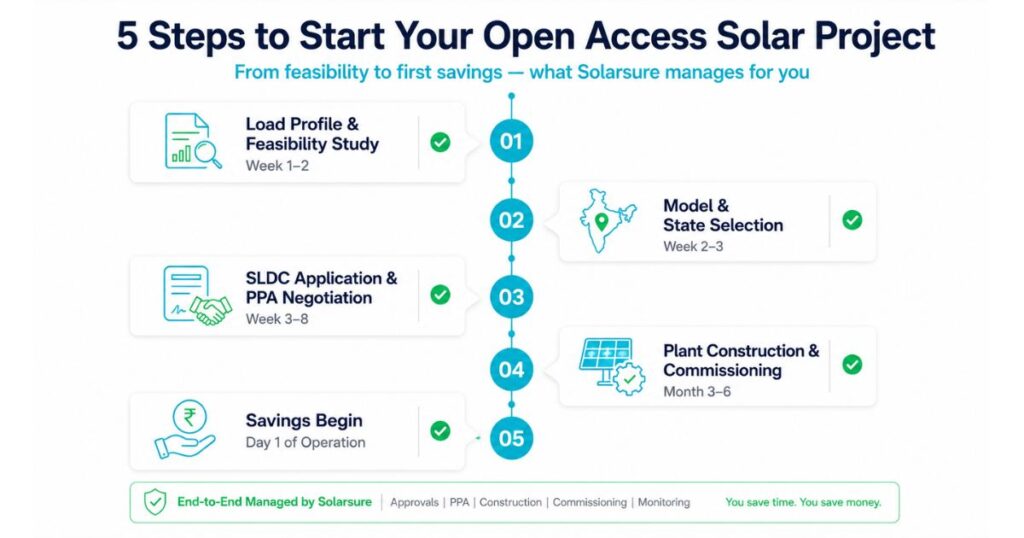
Step 1- Load Profile Analysis and Feasibility (Week 1–2)
Pull your last 12 months of electricity bills. Identify your average monthly consumption, your contracted demand (kVA/kW), your tariff category, and whether you have an HT connection. The ratio of daytime consumption (8 AM–6 PM) to total consumption determines how much of your load can be served by solar and therefore your maximum savings.
Step 2- Model and State Selection (Week 2–3)
Based on your load profile, financial position, and state, determine which model Third-Party PPA, Captive, or Group Captive delivers the best outcome. This is not a generic calculation: CSS levels, banking rules, ISTS waiver status, and irradiance all interact. Solarsure models this for every client before a single quotation is committed.
Step 3- SLDC Application and PPA Negotiation (Week 3–8)
Your EPC or developer files the open access application with the State Load Dispatch Centre (SLDC). Documentation accuracy is everything incomplete applications are the primary cause of approval delays. Karnataka and Gujarat have streamlined to 8–12 weeks. Maharashtra and Tamil Nadu typically take 12–20 weeks. Captive and Group Captive models require additional steps: shareholder agreements and SPV formation add 2–4 weeks.
Step 4- Plant Construction and Commissioning (Month 3–6)
Ground-mounted solar plants at the MW scale take 3 to 5 months to build from land mobilisation to commissioning. Rooftop captive systems are faster 6 to 10 weeks for most industrial installations. Grid synchronisation and DISCOM inspection are the final steps before commercial operation begins.
Step 5- Savings Begin on Day 1 of Operation
Once commissioned and SLDC scheduling is activated, your factory begins drawing solar power in 15-minute blocks coordinated between the plant and your meter. Your monthly DISCOM bill drops immediately, and your solar developer invoices you at the PPA rate plus any applicable charges. The saving begins on the first day of operation and grows every year as DISCOM tariffs continue to escalate.
⚠ The most common execution failure in open access solar is documentation errors at the SLDC application stage. Incorrect metering data, missing NOCs, or incomplete land documents can delay approvals by 3 to 6 months costing you Rs 5–15 lakh per month in savings foregone. This is why EPC experience with SLDC processes in your specific state matters more than panel brand or price-per-watt in the quotation.
📖 You can also read: Cost of a 2 MW Solar Plant in India: DCR vs Non-DCR Breakdown
Frequently Asked Questions
Q: What is the minimum load required for open access solar in India?
A: The minimum contract demand for renewable open access under CERC’s Green Energy Open Access Rules 2022 is 100 kW. Some states still enforce higher thresholds Maharashtra and certain Rajasthan DISCOM zones require 500 kW for some categories. For businesses below the threshold, a Group Captive structure allows multiple MSMEs to pool their consumption and access full captive economics without individual qualification.
Q: What is the difference between Third-Party PPA, Captive, and Group Captive open access?
A: Third-Party PPA: A solar developer owns the plant and sells you electricity at a contracted rate. Zero capital, but CSS and Additional Surcharge apply fully, increasing landed cost. Captive: You own the solar plant (directly or via a subsidiary), consume your own power, and are fully exempt from CSS and Additional Surcharge under the Electricity Act 2003. Group Captive: A consortium of consumers collectively holds 26% equity in a shared plant and consumes 51% of its output, receiving full captive status CSS exempt without individually owning a dedicated plant.
Q: Which states are best for open access solar for MSMEs in India in 2026?
A: Rajasthan and Karnataka offer the best economics for Third-Party PPA due to low wheeling charges and manageable CSS. Madhya Pradesh offers strong economics for both CAPEX captive and open access, particularly for industrial consumers on HT tariffs above Rs 8.80 per unit. Maharashtra has high CSS that makes Third-Party PPA unattractive, but Group Captive delivers strong savings. Tamil Nadu offers good savings potential but banking restrictions (now 15-minute block settlement) require careful load-matched plant sizing.
Q: How much can a factory save with open access solar?
A: A factory in Madhya Pradesh consuming 2 lakh units per month at Rs 8.80/unit spends Rs 17.6 lakh monthly on electricity. Under a Group Captive open access structure with an all-in landed cost of Rs 4.05/unit, the same 2 lakh units cost Rs 8.1 lakh a saving of Rs 9.5 lakh per month, or Rs 1.14 crore per year. This saving grows every year as DISCOM tariffs escalate at 4.5 to 7% annually, while the solar PPA rate remains fixed.
Q: Does open access solar qualify for accelerated depreciation?
A: Yes, but only if you own the solar plant (Captive model) or hold 26% equity in a Group Captive structure. For Captive and Group Captive consumers, the Section 32 accelerated depreciation benefit 40% standard or 60% for manufacturing businesses applies to your equity portion. Third-Party PPA consumers do not receive this benefit because they do not own the asset; the developer claims the depreciation.
Q: How long does it take to get open access solar approval in India?
A: Approval timelines vary significantly by state. Karnataka has streamlined to 8–12 weeks for complete, accurate applications. Gujarat is moving toward single-window clearance with similar timelines. Maharashtra and Tamil Nadu typically require 12–20 weeks. Captive and Group Captive models add 2–4 weeks for SPV formation, shareholder agreements, and equity documentation. Complete, error-free documentation from Day 1 is the single most powerful lever for compressing approval timelines.
Bottom Line
Open access solar is not a niche mechanism or a future option. It is the mechanism that India’s most cost-competitive factories and MSMEs are using right now to reduce their single largest operational cost by 30 to 40 percent permanently. 7.8 GW was added in 2025. 45+ GW is in the pipeline for 2026 and beyond.
The choice is not whether open access solar makes financial sense the numbers in this guide make that case clearly. The choice is which model to use, which state to operate in, and which EPC partner has the SLDC experience to execute the application without delays.
Solarsure manages the full open access process load profile analysis, state and model selection, SLDC application, PPA structuring, plant construction, and grid commissioning. We have executed PM KUSUM and C&I projects across Madhya Pradesh and Rajasthan, and the SLDC process is part of our standard delivery scope not an afterthought.